HTCTS - Session & Time LiquidityHTCTS - Session & Time Liquidity
1. ภาพรวมการทำงาน (Overview)
อินดิเคเตอร์ตัวนี้ทำหน้าที่ 4 อย่างหลักพร้อมกัน:
Auto DST (ปรับเวลาตามฤดูอัตโนมัติ): คุณไม่ต้องมานั่งแก้เวลาเมื่อตลาดต่างประเทศเปลี่ยนเวลา (Daylight Saving Time) เพราะโค้ดอ้างอิง Timezone ของตลาดนั้นๆ โดยตรง (เช่น NY ใช้ America/New_York)
Session Bars: แสดงแถบสีเล็กๆ ด้านล่างจอเพื่อบอกว่าตอนนี้อยู่ใน Session ไหน (Asia, London, NY AM, NY PM, Thai) แทนการถมสีพื้นหลังซึ่งอาจจะรกตา
High/Low Levels & Sweeps: เมื่อจบ Session โปรแกรมจะตีเส้น High และ Low ของช่วงเวลานั้นทิ้งไว้ ถ้ากราฟวิ่งไปชนเส้นเหล่านั้น (Breakout/Sweep) เส้นจะเปลี่ยนเป็นเส้นประและขึ้นข้อความว่า "(Swept)"
1. Indicator Overview and Purpose (ICT/SMC Framework)
This custom Pine Script indicator is designed specifically for traders utilizing ICT (Inner Circle Trader) or SMC (Smart Money Concepts) methodologies. Its primary function is to simplify the analysis of Time & Price by automatically defining and tracking key market sessions, their resulting liquidity levels (High/Low), and detecting liquidity sweeps (Stop Hunts).
The indicator is designed to be Zero-Maintenance regarding time zones, as it automatically adjusts for Daylight Saving Time (DST) changes in major financial centers (London, New York).
2. Key Features and Logic
A. Automatic DST Handling (Auto-DST)
The script uses specific, location-based time zones for global markets instead of a fixed GMT/UTC offset.
Asia: Uses Asia/Tokyo.
London: Uses Europe/London (Automatically adjusts for BST).
New York (AM/PM): Uses America/New_York (Automatically adjusts for EST/EDT).
This guarantees that the session times displayed on your chart (regardless of your local time, e.g., Thailand GMT+7) always align with the actual opening and closing moments of the corresponding financial market.
חפש סקריפטים עבור "session high"


Session important reference linesThis indicator automatically plots crucial price reference points for the Regular Trading Hours (RTH) session, including Yesterday's High/Low/Close, Session Open, Midpoint, and the Initial Balance (IB) range with its 2x extension .
In the example above the lines are:
Dotted green - Today's open price
Dashed yellow - Today's mid line
Solid yellow - Initial Balance high/low
Dotted yellow - Initial Balance extension
Dotted dark green - Previous session high
Dotted dark red - Previous session low
Dotted orange - Previous session close

SPY SRX S&R Levels - Premium EditionSRX SPY Predictive Support & Resistance Levels
SRX is not a typical TradingView support/resistance indicator.
These levels are not calculated on TradingView at all . Instead, every morning after market open, nearly 20,000 data points are analyzed externally to determine where SPY is statistically most likely to react.
This produces support and resistance levels that are hyper-accurate, mathematically derived, and consistently respected intraday , not hand-drawn guesses or generic indicator outputs.
On top of that, SRX plots dynamic volatility-based zones around each major level so you can catch moves that don’t hit the level penny-perfect.
SRX also generates Buy/Sell Arrows during trending conditions and Buy/Sell Circles during non-trending or early-trend conditions.
Arrows = higher-probability trend-aligned setups.
Circles = lower-confidence ideas that can often be scalped on 1m–3m charts.
This tool is built for traders who want clarity, precision, and the ability to anticipate key reactions on SPY with confidence.
Features:
Externally Calculated SRX Levels: Nearly 20,000 data points analyzed daily to produce statistically significant support & resistance levels.
Dynamic Volatility Zones: Capture moves that don’t hit levels perfectly with automatically adjusting upper/lower zones.
Expected Daily Range: Session high/low projections based on historical and current volatility.
Support Levels (S1–S4): Up to four graduated support zones for precision planning.
Resistance Levels (R1–R4): Up to four graduated resistance zones built from the same predictive model.
Premarket High/Low (PMH/PML): Toggleable levels from premarket session.
Previous Day High/Low (PDH/PDL): Quickly mark the prior day’s key reaction points.
Previous Day Open/Close (PDO/PDC): Additional contextual levels (toggle on/off).
Buy/Sell Arrows: Trigger when price interacts with both the EMA and an SRX level/zone in trending conditions.
Buy/Sell Circles: Trigger in non-trending environments — lower confidence but often scalp-friendly.
EMA Overlay: Adjustable EMA used for signal confirmation (default length 8).
Runway Filter: Optional filter that improves signal quality by measuring available “runway” before the next SRX level.
Near EMA Touch Logic: Helps detect momentum shifts and avoid false signals.
Bias Filter: Determines whether the market is trending up, trending down, or neutral — off by default but extremely powerful.
Historical Data Section: View previous SRX levels for backtesting and strategy review.
Customizable Appearance: Colors, transparency, labels, arrows, zone styling and more.
Built-In Alerts:
Zone/Level Touch or Cross
PMH/PML Touch or Cross
PDH/PDL Touch or Cross
PDO/PDC Touch or Cross
Max-Range High/Low Reached
Buy/Sell Arrow Signals
How to Use:
Copy the daily SRX data string from the official Discord channel.
Paste it into the “SRX Levels Input” field inside the indicator settings.
Customize colors, zones, EMA, signals, and filters to match your trading style.
Use SRX support/resistance levels as the foundation for intraday setups.
Use Arrows when the market is trending and the bias is clear.
Use Circles cautiously during choppy or unconfirmed conditions (often great for scalp entries on 1m/3m).
Optionally enable alerts for level reactions or signal prints.
Ideal For:
Intraday traders who rely on precise support/resistance
SPY scalpers seeking high-probability reaction zones
Momentum traders catching breakouts or bounces
Traders who want statistical structure, not subjective drawings
Important Notes:
SRX levels are calculated externally using proprietary models.
This indicator requires a paid subscription to access the daily SRX support/resistance data.
Daily levels are delivered through our private Discord.
Without the SRX daily data string, the indicator will not display levels.
You can join here to get access to the SRX Levels feed:
stockalertsreviewed.clickfunnels.com
SRX currently works exclusively with SPY (as of Dec 2025). We plan to expand to additional tickers in 2026.
Buy/Sell signals are trade ideas — always confirm with market context.

Optimal Trading Sessions + High Lines (London Time)Optimal Sessions Session Time (London) Notes
London Open 08:00–10:00 Strong breakouts + continuation
NY Pre-market 12:30–14:00 Good directional moves begin
NY Open (MOST VOLATILE) 14:30–16:00
Best RR trades of the day
Stop Trading After 17:00
Choppy, low quality
Avoid:
❌ Lunch time (10:45–12:00) — range, fakeouts
❌ After 17:00 — low volume and spikes

Cognex Fibonacci Breakout StrategyTHE COMPLETE TRADE LOGIC (What We Want):
Step 1: Morning Session (9:30-10:30)
Track session high and low
Step 2: After 10:30 - Wait for Breakout
Bullish: Close above session high
Bearish: Close below session low
Step 3: Track Extreme After Breakout
Keep updating highest_after_breakout or lowest_after_breakout
This continuously updates as price makes new extremes
Step 4: Detect 28% Retracement (THE LOCK)
When price retraces to 28%, set last_extreme_for_retracement to the current extreme
This LOCKS the extreme for fibonacci calculations
fib_100 should use this locked value
Step 5: Place Limit Order EARLY (at 20% retracement)
When price retraces to 20%, place limit order at 28% entry
This is so the order is ready when price hits 28%
Step 6: Cancel & Recalculate if New Extreme
If price makes a NEW extreme AFTER the order is placed
Cancel the old order
Wait for new 20% retracement to place new order
Step 7: One Trade Per Day
Only ONE order placement attempt per day
Even if cancelled, don't try again

ORB Pro SuiteOverview
ORB Pro with Filters + Debug Overlay is an advanced Opening Range Breakout indicator designed for precision intraday trading. It defines a configurable ORB window, automatically builds the breakout range, and triggers long or short signals only when all active filters align. The script also includes a built-in debug overlay that explains why each breakout is accepted or blocked, allowing traders to fine-tune entries with transparency.
What Makes It Unique
• Modular filter stack – close-confirmation vs. instant breaks, retest confirmation with adjustable tolerance %, volume-spike and EMA-trend filters, ORB-size range, session cutoff, and cooldown logic.
• Non-blocking debug overlay – inline or corner display of the exact rejection reason (“Too late,” “Low volume,” “Trend mismatch,” etc.).
• Fully customizable visuals – choose shaded, outline, or line-only ORB styles; set opacity, border color, and right-edge offset so the box never hides current candles.
• Integrated reversal engine – detects doji, hammer, and engulfing structures within a time-filtered window and optional VWAP/EMA confluence.
How It Works
During the defined opening window (default 9:30 – 9:45 NY), the indicator records the session high and low.
After the box closes, it looks for breakouts confirmed by candle close or retest (per user settings).
Each signal passes through range, volume, trend, time-delay, and session filters before printing.
Visual stop-loss / take-profit levels appear for reference using either R:R multiples or fixed %.
The optional reversal layer marks short-term exhaustion zones for counter-scalp setups.
Usage Guidelines
• Apply to standard candlestick charts (not Heikin Ashi, Renko, or Range).
• Select your local ORB start / end time, then enable or disable filters based on your playbook.
• Use the “Outline only” or “Corner table” debug modes for a cleaner chart.
• The script provides visual and alert-based confirmations only; it does not execute orders or backtest performance.
Inputs at a Glance
– ORB window (start/end time)
– Close-confirm toggle
– Retest tolerance %
– Volume SMA length
– EMA length for trend filter
– Min/Max range % filter
– Cooldown bars and session cutoff
– Visual R:R ratio or fixed SL/TP %
– Box style, opacity, border width / color
– Debug overlay mode (inline or table) and leader lines
Notes & Disclaimers
• This script is for analysis and educational purposes only. It does not constitute financial advice or guarantee performance.
• Signals are calculated on completed bars without lookahead.
• Invite-only access ensures version integrity and controlled distribution.
© Trades with B – Original development in Pine v6. Reuse of this code requires explicit permission from the author.

Current Session H/L — EvolvingTrack the current session high and low as it's formed. Lines are projected back to previous sessions and forward in time. Bot projections are adjustable.

Average Daily Range DashboardThis script displays a non-intrusive ADR (Average Daily Range) dashboard designed to assist traders in monitoring real-time range expansion throughout the trading session. It compares the current day's high-low range to the average daily range calculated over a user-defined number of previous completed days (default: 5).
The tool provides a numerical ADR score (0–5) based on how much of the average daily range has been filled. It also includes optional visual cues and narrative descriptions to help contextualize current price behavior.
📘 Key Features:
Calculates ADR using fully completed daily bars (excluding the current session)
Tracks the current session’s intraday range live (high to low)
Outputs a score from 0 (low range expansion) to 5 (ADR fully filled or exceeded)
Optional alerts when ADR thresholds are crossed (e.g., 60%, 100%)
Displays optional debug values: ADR value, today’s range, session high/low
Customizable table position, size, colors, and visibility settings
🧮 Formula Transparency:
ADR = Simple Moving Average of (Daily High - Low) over the last N completed days
Intraday Range = Real-time (Session High - Session Low)
ADR Score is derived by comparing current range to ADR:
score = floor((sessionRange / adr) * 5), capped at 5
⚠️ Disclaimer:
This tool does not provide buy/sell signals, trading advice, or predictive forecasts. It is intended for educational and informational purposes only. Users should independently verify all data and apply their own analysis. Past performance of any range behavior is not indicative of future results.

Overnight Time Box Overnight Time Box (22:59 → 09:59, minutes & TZ)
Automatically draws a time-based box for a customizable window that can cross midnight. Perfect for marking the overnight range up to London open (e.g., 22:59–09:59 in Europe/Bucharest), but works with any minute-level window.
What it does
Builds a daily box covering all price action between two user-defined times (e.g., 22:59 → 09:59).
Tracks session High/Low in real time and can plot extended HL lines for reference.
Keeps historical boxes on the chart for backtesting and review (no flicker, no errors).
How to use
Add the script to an intraday chart.
Configure:
Time zone (default: Europe/Bucharest).
Interval (HHMM-HHMM) — e.g., 2259-0959 (minutes supported).
Optional: High/Low lines, fill color, border color, line width.
Use on intraday timeframes (M1–H4).
Note: On Daily/Weekly/Monthly, a heads-up label reminds you it’s designed for intraday use.
Inputs
Time zone: correct DST handling.
Interval (HHMM-HHMM): supports windows that span midnight.
Draw High/Low lines: extended HL guides for the session.
Colors & widths: full visual customization.
Use cases
Mark the overnight range into London open (10:00 RO).
Delimit Killzones / ICT Silver Bullet windows.
Study range, liquidity raids, FVGs before major sessions.
Tech notes
Built on Pine Script v5 using input.session → stable, DST-safe.
Increased max_boxes_count / max_lines_count to preserve history.
Boxes are “frozen” at session end and remain on chart.
Limitations
Intended for intraday only.
One interval per script instance; attach multiple instances for multiple windows.

OmniTraderOmniTrader — What It Does
A pragmatic intraday toolkit that keeps your chart readable while surfacing the levels traders actually use: EMAs across timeframes, VWAP, yesterday’s high/low, Asian/London/NY session ranges, and a configurable Opening Range Breakout (ORB).
Multi-Timeframe EMAs (EMA 1 & 2) — Pick any TF per EMA (e.g., 5m EMA on a 1m chart).
VWAP — Toggle on/off for quick mean/flow context.
Session High/Low (live → frozen)
Tracks Asian / London / New York in your chart/exchange timezone.
Rays auto-extend; labels optional.
Previous Day High/Low — Daily levels with optional labels; auto-resets each new day.
Opening Range Breakout (ORB)
Choose session (NY/London/Asian) and 15m or 30m window.
Levels update live during the window, then lock.
Separate colors for ORB High & ORB Low + labels.
Style & Clarity Controls — Per-group color pickers, line width/style, label size & visibility.
Designed to minimize clutter while keeping essentials visible.

Gold H1 Breakout Failure (V11.0)This strategy is designed for trading XAU/USD (Gold) on the 1-hour timeframe. It identifies and trades fake breakouts of the Asian session range.
The logic is simple yet effective:
The script first marks the Asian session high and low.
Once price breaks out of this range and closes outside, it waits for confirmation by watching for price to close back inside the range.
When this re-entry occurs, the strategy takes a position in the opposite direction of the initial breakout, anticipating a false breakout or liquidity trap setup.
By focusing on these fakeouts, the strategy aims to capture reversal momentum after liquidity sweeps, making it especially effective during sessions when volatility transitions from Asia to London or New York.

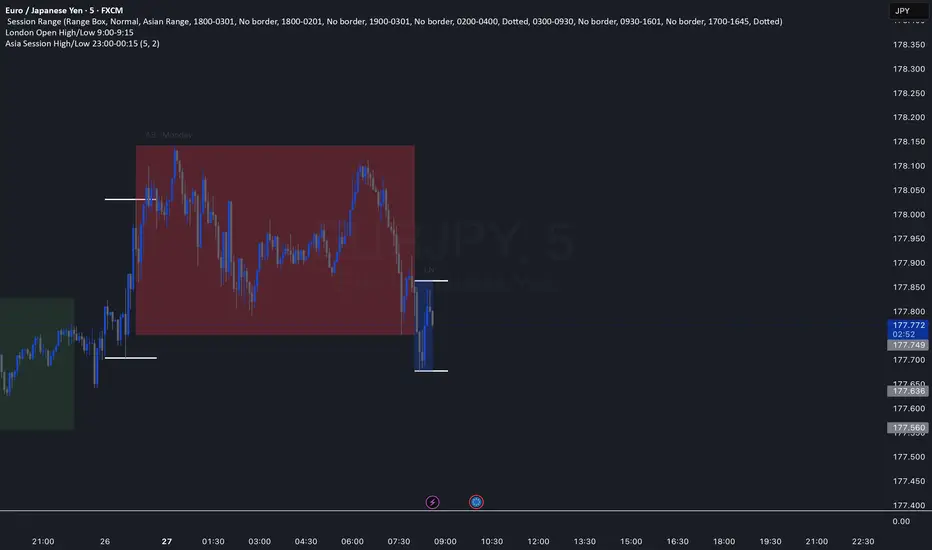
Asia Session High/Low 23:00-00:15This indicator shows highs and lows 1 hour before Asia session and the first 15min of Asia session.
The Wave Levels (ORB Indicator)This Indicator is made for the ORB trader. It's purpose is to help make your charting faster by providing some basic key levels to reference at a glance. This was optimized to be used on the 5m timeframe.
Key features:
1. Green and Red ORB rays to indicate the 15 minute Opening Range. These ranges will only extend as long as its respective session's length.
2. Previous sessions zones for historical easily identification of historical data (best used in UTC-4 timezone)
3. White Liquidity Rays. These rays are used to mark a previous session's high or low which hasn't been swept yet. This makes for a good TP area or identifying a potential reversal area.
Once a previous session high or low has been taken, the ray will automatically remove.
I am not a professional coder. This indicator was created by continuously prompting AI commands over the course of 3 days.

US30 Quarter Levels (125-point grid) by FxMogul🟦 US30 Quarter Levels — Trade the Index Like the Banks
Discover the Dow’s hidden rhythm.
This indicator reveals the institutional quarter levels that govern US30 — spaced every 125 points, e.g. 45125, 45250, 45375, 45500, 45625, 45750, 45875, 46000, and so on.
These are the liquidity magnets and reaction zones where smart money executes — now visualized directly on your chart.
💼 Why You Need It
See institutional precision: The Dow respects 125-point cycles — this tool exposes them.
Catch reversals before retail sees them: Every impulse and retracement begins at one of these zones.
Build confluence instantly: Perfectly aligns with your FVGs, OBs, and session highs/lows.
Trade like a professional: Turn chaos into structure, and randomness into rhythm.
⚙️ Key Features
Automatically plots US30 quarter levels (…125 / …250 / …375 / …500 / …625 / …750 / …875 / …000).
Color-coded hierarchy:
🟨 xx000 / xx500 → major institutional levels
⚪ xx250 / xx750 → medium-impact levels
⚫ xx125 / xx375 / xx625 / xx875 → intraday liquidity pockets
Customizable window size, label spacing, and line extensions.
Works across all timeframes — from 1-minute scalps to 4-hour macro swings.
Optimized for clean visualization with no clutter.
🎯 How to Use It
Identify liquidity sweeps: Smart money hunts stops at these quarter zones.
Align structure: Combine with session opens, order blocks, or FVGs.
Set precision entries & exits: Trade reaction-to-reaction with tight risk.
Plan daily bias: Watch how New York respects these 125-point increments.
🧭 Designed For
Scalpers, day traders, and swing traders who understand that US30 doesn’t move randomly — it moves rhythmically.
Perfect for traders using ICT, SMC, or liquidity-based frameworks.
⚡ Creator’s Note
“Every 125 points, the Dow breathes. Every 1000, it shifts direction.
Once you see the rhythm, you’ll never unsee it.”
— FxMogul

TJR asia session sweepThe TJR Asia Session Sweep is a liquidity-based trading strategy that focuses on the Asian session high and low range. During the London open, price often sweeps (breaks) one side of that range to grab liquidity — triggering stop hunts. After the sweep, traders look for a break of structure (BOS) and enter in the opposite direction of the sweep.
AlgoIndex - All Stages (AM & Mid-Day Long/Short)Scope (read first)
ES1! on 5-minute only. The strategy backtests ES fills; alerts can post JSON messages to a Webhook URL you configure. Exits are target-based with ITTC - if ES touches target intra-bar, an exit alert is sent immediately. No fixed ES stop-loss. Positions can also exit at scheduled time-based safety closes (session end, holiday/half-day, or expiration end). You can always close manually.
What this is
One intraday engine with four session presets (“Stages”). Stages only change session windows, trade side, and a few risk/confirmation governors—the core logic is the same. Single invite-only listing; not a multi-post suite.
How it trades
Opening Range (OR): Each Stage begins with a short OR at its session start; that Stage won’t take entries until its OR closes.
VWAP alignment: Trade with flow. Price must align with VWAP (simple pass/fail; optional gap offset).
Real breakouts only: A composite “impulse” check looks for volume expansion, recent momentum, ATR-scaled range, body/range quality, and a clean OR break (or a gap-aware extension).
Entry & target: Entries occur on the signal bar’s close; targets are set in underlying (ES) units.
ITTC (close on touch): If ES touches target intra-bar, ITTC sends a one-shot exit.
Adds (preset by Stage): S1/S2/S3 allow up to two adds on defined ES retraces; S4 disables adds. Adds use a fixed scale-out policy handled internally—no user input required.
Time-based safety closes: At the configured session end (and on holiday/half-day or expiration when applicable), any open position is closed. These are time exits, not price stops.
Why traders use it
A progressive filter for intraday continuity: OR context → VWAP alignment → authentic breakout (impulse) → ITTC to sync ES triggers with options execution. Stage-governed adds keep scaled positions coherent from open to close.
Stages (session templates; one engine)
S1 — 09:30–11:20 NY, Long-only. Standard impulse; adds ON.
S2 — 09:30–11:30 NY, Short-only. Tighter breakout standard; adds ON.
S3 — 11:15–15:15 NY, Long-only. Trade-protection ON; slightly lower underlying target; adds ON.
S4 — 11:30–14:30 NY, Short-only. Alternative trigger governor; slightly lower underlying target; adds OFF.
You can replicate any Stage via session times, side, and thresholds; presets exist for convenience and auditability.
Public inputs (what you can adjust)
Contracts (order size)
TP (Underlying) and TP (Options)
Trade Limiter (toggle) + Max profitable trades per session
Session settings: Exchange Day Session times, optional Custom Time Zone, Session 1 times, optional Session 2, and day-of-week checkboxes
Visual overlays (display-only): VWAP, Prior-Day High/Low, Session High/Low, Round Numbers, Bias Banner, Trade Markers
Display: Inputs in status line
Alerts (how to use)
Create an alert on this strategy and select “Any alert() function call.” (Optional) add a Webhook URL you control to receive the JSON the script sends. Leave Message empty.
Backtest vs options (read carefully)
Backtests show ES fills on 5-minute bars; options pricing (IV, DTE, spreads, partial fills) isn’t simulated. Because live execution uses options, ES PnL is a directional proxy only.
Evaluate quality via: trade count (target ≥100), win rate, average time-in-trade, MAE/MFE, and holding-time distribution. Do not read ES $ PnL as expected options returns—actual options outcomes depend on strike/DTE, IV regime, spreads, and execution.
Defaults used in this publication (match these before interpreting results)
Dataset: last 12–24 months of ES1! 5-minute RTH (to ensure ≥100 trades)
Initial capital: $25,000
Commission: $1.00 per order per contract (≈ $2 round-trip)
Slippage: 1 tick
Order size: 1 contract; pyramiding only for Stage-governed adds
No fixed ES stop-loss; exits are target-based with ITTC and scheduled safety closes
Operating notes
ES1! symbol only; 5-minute resolution only
You can run multiple Stages in parallel via separate tabs/alerts; if you want a single net position across Stages, enforce it in your own tooling (e.g., ignore new orders while a position is open)
Use a clean chart when publishing (only this strategy active)
Keep results separate by using four TradingView tabs (one per Stage)
Disclosures
Educational research tool, not financial advice. Past or hypothetical performance does not guarantee future results. Trading involves risk, including the risk of loss. Test thoroughly and use at your own discretion.

Watermark with Session Boxes (by Rufi)Watermark & Session Boxes - Chart Branding Tool
What it does: Combines professional chart watermarking with automated trading session visualization for clean, branded analysis.
Key Features:
Smart Session Boxes: Auto-draws boxes around Asia (8PM-11:59PM), London (2AM-5AM), and NY (7AM-10AM) sessions using high/low detection
Custom Watermark: Professional text overlay with your brand/tagline
Full Customization: Adjustable colors, transparency (0-100%), and display limits (1-30 days)
How it works: Uses Pine Script's time() function to detect session periods, tracks price extremes during each session, then draws filled rectangles from session high to low. Perfect for identifying key support/resistance levels from major trading periods.
Best for: Intraday traders who want branded charts with clear session-based S/R levels. Ideal for forex, indices, and crypto on lower timeframes.

All in oneict trading session, silver bullet. perfect session of trading. help with timing to enter for max profit. also with high and low of previous day, week, month

Trading Sessions (L3J) Trading Sessions Indicator (L3J)
Overview
This Pine Script indicator displays precise trading session boxes for the three major global trading sessions: Asia, London, and US (Cash). Unlike traditional session indicators that show continuous background colors, this script creates rectangular boxes that precisely delimit each session from start to finish.
Features
🌍 Global Timezone Support
- 39 timezone options covering all major financial centers
- Automatic daylight saving time adjustments for named timezones
- Universal compatibility with all TradingView charts
📦 Session Boxes
- Precise delimitation: Each session is contained within a rectangular box
- Dynamic sizing: Boxes automatically adjust to session high/low prices
- Visual distinction: Completed sessions (solid borders) vs ongoing sessions (dashed borders)
- Customizable borders: Toggle on/off with adjustable thickness (0-5px)
🎨 Visual Customization
- Individual session colors: Fully customizable for Asia, London, and US sessions
- Border matching: Border colors automatically match session box colors
- Transparency control: Built-in opacity settings for each session
- Clean interface: Minimal visual clutter with maximum information
⚙️ Management Options
- Box limit control: Set maximum number of historical boxes per session (1-50)
- Automatic cleanup: Old boxes are automatically removed to maintain performance
- Memory efficient: Optimized for long-term chart analysis
Default Session Times (EDT - Etc/GMT+4)
| Session | Default Hours | Markets Covered |
|---------|---------------|-----------------|
| Asia | 18:00 - 02:00 | Tokyo, Sydney, Hong Kong |
| London | 02:00 - 11:00 | London, Frankfurt, European markets |
| US Cash | 09:30 - 16:00 | NYSE, NASDAQ |
> Note: Default times are in EDT (Eastern Daylight Time). Adjust session hours according to your selected timezone.
Timezone Conversion Examples
For UTC Users:
- Asia: 22:00 - 06:00
- London: 06:00 - 15:00
- US: 13:30 - 20:00
For Europe/London Users:
- Asia: 23:00 - 07:00
- London: 07:00 - 16:00
- US: 14:30 - 21:00
Usage Instructions
1. Add to chart: Apply the indicator to any timeframe
2. Select timezone: Choose your local timezone from the dropdown
3. Adjust session hours: Modify session times if needed for your timezone
4. Customize appearance: Set colors, borders, and box limits
5. Enable/disable sessions: Toggle individual sessions on/off as needed
Technical Specifications
- Pine Script Version: v6
- Chart Type: Overlay indicator
- Maximum Objects: 150 boxes, 500 lines, 200 labels
- Performance: Optimized for real-time updates
- Compatibility: All TradingView chart types and timeframes
Integration with Other Scripts
This indicator is designed to work seamlessly with other L3J trading scripts:
- ICT Levels Indicators: Provides session context for key levels
- Market Structure Scripts: Session boxes help identify structural breaks
- Volume Profile Tools: Session delimitation for volume analysis
- Support/Resistance Scripts: Session-based level identification
> Recommended: Use this as a base layer with other L3J indicators for comprehensive market analysis.
Key Benefits
🎯 Precision Trading
- Exact session boundaries: No guesswork about session start/end times
- Clean visual reference: Clear session delimitation for strategy execution
- Multi-timeframe compatibility: Works on all chart timeframes
📊 Professional Analysis
- Institution-grade accuracy: Matches professional trading platforms
- Customizable for any strategy: Adaptable to various trading approaches
- Performance optimized: Minimal impact on chart loading times
🔄 Real-time Updates
- Live session tracking: Ongoing sessions update in real-time
- Automatic management: Old sessions are cleaned up automatically
- Memory efficient: Optimized for extended trading sessions
Author Information
Created by: L3J
Version: 1.0
Category: Session Analysis / Market Hours
License: For use with L3J trading script ecosystem
---
Support & Integration
This indicator is part of the L3J Trading Script Collection. For optimal results, combine with other L3J indicators:
- ICT Key Levels
- Market Structure Analysis
- Volume Profile Tools
- Support/Resistance Scripts
Note: This script is specifically designed to complement and enhance other L3J trading tools. Individual use is supported, but maximum effectiveness is achieved when used as part of the complete L3J trading system.
---
For technical support or integration questions, refer to the L3J script documentation or community resources.

Pivot Points mura visionWhat it is
A clean, single-set pivot overlay that lets you choose the pivot type (Traditional/Fibonacci), the anchor timeframe (Daily/Weekly/Monthly/Quarterly, or Auto), and fully customize colors, line width/style , and labels . The script never draws duplicate sets—exactly one pivot pack is displayed for the chosen (or auto-detected) anchor.
How it works
Pivots are computed with ta.pivot_point_levels() for the selected anchor timeframe .
The script supports the standard 7 levels: P, R1/S1, R2/S2, R3/S3 .
Lines span exactly one anchor period forward from the current bar time.
Label suffix shows the anchor source: D (Daily), W (Weekly), M (Monthly), Q (Quarterly).
Auto-anchor logic
Intraday ≤ 15 min → Daily pivots (D)
Intraday 20–120 min → Weekly pivots (W)
Intraday > 120 min (3–4 h) → Monthly pivots (M)
Daily and above → Quarterly pivots (Q)
This keeps the chart readable while matching the most common trader expectations across timeframes.
Inputs
Pivot Type — Traditional or Fibonacci.
Pivots Timeframe — Auto, Daily (1D), Weekly (1W), Monthly (1M), Quarterly (3M).
Line Width / Line Style — width 1–10; style Solid, Dashed, or Dotted.
Show Labels / Show Prices — toggle level tags and price values.
Colors — user-selectable colors for P, R*, S* .
How to use
Pick a symbol/timeframe.
Leave Pivots Timeframe = Auto to let the script choose; or set a fixed anchor if you prefer.
Toggle labels and prices to taste; adjust line style/width and colors for your theme.
Read the market like a map:
P often acts as a mean/rotation point.
R1/S1 are common first reaction zones; R2/S2 and R3/S3 mark stronger extensions.
Confluence with S/R, trendlines, session highs/lows, or volume nodes improves context.
Good practices
Use Daily pivots for intraday scalps (≤15m).
Use Weekly/Monthly for swing bias on 1–4 h.
Use Quarterly when analyzing on Daily and higher to frame larger cycles.
Combine with trend filters (e.g., EMA/KAMA 233) or volatility tools for entries and risk.
Notes & limitations
The script shows one pivot pack at a time by design (prevents clutter and duplicates).
Historical values follow TradingView’s standard pivot definitions; results can vary across assets/exchanges.
No alerts are included (levels are static within the anchor period).

Liquidity Sweep Breakout - LSBLiquidity Sweep Breakout - LSB
A professional session-based breakout system designed for OANDA:USDJPY and other JPY pairs.
Not guesswork, but precision - built on detailed observation of institutional moves to capture clear trade direction daily.
Master the Market’s Daily Bank Flow.
---
Strategy Detail:
I discovered this strategy after carefully studying how Japanese banks influence the forex market during their daily settlement period. Banks are some of the biggest players in the financial world, and when they adjust or settle their accounts in the morning, it often creates a push in the market. From years of observation, I noticed a consistent pattern, once banks finish their settlements, the market usually continues moving in the same direction that was formed right after those actions. This daily banking flow often sets the tone for the entire trading session, especially for JPY pairs like USDJPY.
To capture this move, I built the indicator so that it follows the bank-driven trend with clear rules for entries, stop-loss (SL), and take-profit (TP). The system is designed with professional risk management in mind. By default, it assumes a $10,000 account size, risks only 1% of that balance per trade, and targets a 1:1.5 reward-to-risk ratio. This means for every $100 risked, the potential profit is $150. Such controlled risk makes the system safer and more sustainable for long-term traders. At the same time, users are not limited to this setup, they can adjust the account balance in the settings, and the indicator will automatically recalculate the lot size and risk levels based on their own capital. This ensures the strategy works for small accounts and larger accounts alike.
🌍 Why It Works
Fundamentally driven: Based on **daily Japanese banking settlement flows**.
Session-specific precision: Targets the exact window when USDJPY liquidity reshapes.
Risk-managed: Always calculates lot size based on account and risk preferences.
Automatable: With webhook + MT5 EA, it can be fully hands-free.
---
✅ Recommended
Pair: USDJPY (best observed behavior).
Timeframe: 3-Minute chart.
Platform: TradingView Premium (for webhooks).
Execution: MT5 via EA.
---
🔎 Strategy Concept
The Tokyo Magic Breakout (TMB) is built on years of session observation and the unique daily rhythm of the Japanese banking system.
Every morning between 5:50 AM – 6:10 AM PKT (09:50 – 10:10 JST), Japanese banks perform daily reconciliation and settlement. This often sets the tone for the USDJPY direction of the day.
This strategy isolates that critical moment of liquidity adjustment and waits for a clean breakout confirmation. Instead of chasing noise, it executes only when price action is aligned with the Tokyo market’s hidden flows.
---
🕒 Timing Logic
Session Start: 5:00 AM PKT (Tokyo market open range).
Magic Candle: The 5:54 AM PKT candle is marked as the reference “breakout selector.”
Checkpoints: First confirmation at 6:30 AM PKT, then every 15 minutes until 8:30 AM PKT.
* If price stays inside the magic range → wait.
* If a breakout happens but the candle wick touches the range → wait for the next checkpoint.
* If by 8:30 AM PKT no clean breakout occurs → the day is marked as No Trade Day (NTD).
👉 Recommended timeframe: 3-Minute chart (3M) for precise signals.
---
📈 Trade Execution
Entry: Clean break above/below the magic candle’s range.
Stop-Loss: Opposite side of the Tokyo session high/low.
Take-Profit: Calculated by Reward\:Risk ratio (default 1.5:1).
Lot Size: Auto-calculated based on your risk model:
* Fixed Dollar
* % of Equity
* Conservative (minimum of both).
Visuals include:
✅ Entry/SL/TP lines
✅ Shaded risk (red) and reward (green) zones
✅ Trade labels (Buy/Sell with lot size & levels)
✅ TP/SL hit markers
---
🔔 Alerts & Automation (AutoTMB)
This strategy is fully automation-ready with EA + MT5:
1. Enable alerts in TMB settings.
2. Insert your PineConnector License Key.
3. Configure your risk management preferences.
4. Create a TradingView alert → in the message box simply type:
Pine Script®
{{alert_message}}
and set the EA webhook.
Now, every breakout trade (with exact entry, SL, TP, and lot size) is sent instantly.
👉 On your MT5:
* Install the EA.
* Use the same license key.
* Run it on a VPS or local MT5 terminal.
You now have a hands-free trading system: AutoTMB.
